Knowledge Graph
What is Knowledge graphs?
Knowledge Graphs are a way to store both information and its meaning. In a layman, language Knowledge graphs are nothing but digitizing knowledge with data. Knowledge graphs are powerful in the field of data management and artificial intelligence. They represent a structured way of organizing information, which allows for more effective analysis and insight generation, where users can quickly find relevant information and uncover hidden patterns by solving business needs in a much faster way. Knowledge graphs are typically made up of datasets from various sources, which frequently differ in structure. Schemas, identities, and context to work together which providers structure to diverse data & its Sources. Schemas provide the framework for the knowledge graph, help identities classify which are underlying appropriately, and the context determines the setting in which that knowledge exists. These components help distinguish words with multiple meanings. Eg . if you search " Apple" in Google, Google’s search engine algorithm, determines the difference between Apple, the brand, and Apple, the fruit.
How Knowledge graphs works?
Graph databases are OLTP-based, where graph tech eliminates most of the data-fabricated products that are needed for data management. Knowledge graphs make use of Graph databases which helps in simplifying Metadata & Master data or replacing them. Knowledge graphs, which are fuelled by machine learning, utilize natural language processing (NLP) to construct a comprehensive view of nodes, edges, and labels through a process called semantic enrichment. When data is ingested, this process allows knowledge graphs to identify individual objects and understand the relationships between different objects. This working knowledge is then compared and integrated with other datasets, which are relevant and similar in nature. Once a knowledge graph is complete, it allows question-answering and search systems to retrieve and reuse comprehensive answers to given queries. While consumer-facing products demonstrate their ability to save time, the same systems can also be applied in a business setting, eliminating manual data collection and integration work to support business decision-making. The data integration efforts around knowledge graphs can also support the creation of new knowledge, establishing connections between data points that may not have been realized before.
Why knowledge graphs?
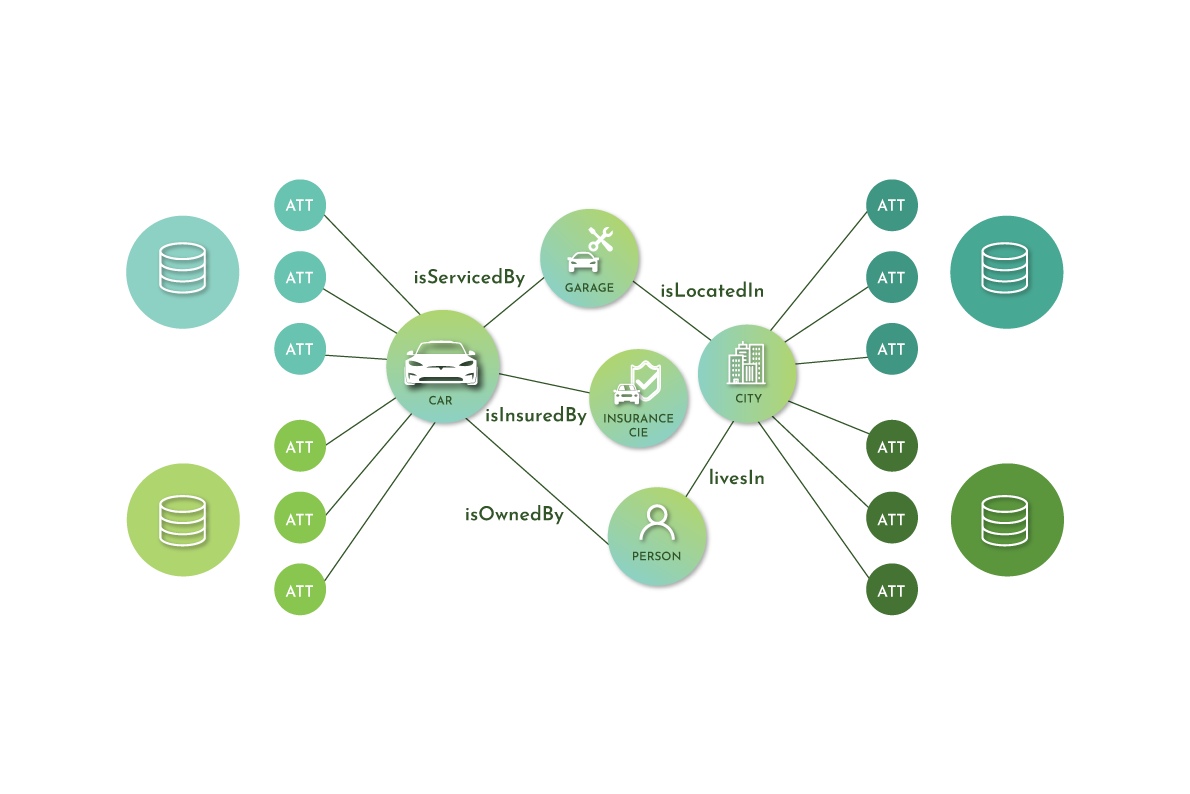
One of the most valuable and fundamental uses of Knowledge Graphs is to express relationships between the data. Like, Knowledge Graphs help to combine disparate silos of data, giving you an overview of all of your knowledge – not only departmentally but also across departments and global organizations. Knowledge Graphs visualize the nature of the underlying relationship and how they are interconnected to gain sufficient understanding of the landscape to improve intelligent strategic business decisions. Using a Knowledge Graph means no more looking through multiple products to find particular information as Knowledge Graphs provide relevant facts and contextualized answers to your specific questions, rather than a broad search result with lots of irrelevant information. Knowledge Graphs provide a model of how everything is related, having each subject or object represented only once with all its relationships, in the context of all of the other subjects and their relationships. This makes it possible to see how everything is related at a big-picture level. Knowledge Graphs are great for revealing communities, which are fundamental to understanding macro relationships and dynamics in business data. Communities in a Knowledge Graph visualization are qualitatively reflected by clusters of related members in close proximity, distinguishable from the field of another graph member. Linking communities provides useful information about patterns of interest and influence. Knowledge Graphs are also a great way to visualize a flow of information – showing information flows of a business process or any transactional activities that may reveal hidden risks or show patterns over time.