Pharma
The pharmaceutical industry is undergoing a revolution with the use of knowledge graphs. Graph technology is revolutionizing the way the pharmaceutical industry approaches drug repurposing, discovery and development With the ability to handle large amounts of data and identify relationships and Connections between different data points, graph technology enables the discovery of new drug targets, the identification of new drug interactions, and the analysis of complex patient data to optimize clinical trials. Knowledge graphs can be used to represent everything from drug molecules and proteins to clinical trial results and patient data, providing a holistic view of the drug development process. They also enable the integration of external data sources such as scientific literature, patents and clinical trial data, under one single graph data.
Solutions
Drug Repositioning/Repurposing
Drug repositioning, also known as drug repurposing, is the process of identifying new therapeutic uses for existing drugs. Knowledge graphs can be used to support this process by storing and analyzing large sets of data on drugs, diseases, and the relationships between them. In drug repositioning, knowledge graphs can be used to represent the complex relationships between drugs, target proteins, disease symptoms, and other related entities. For example, a node representing a drug can be connected to nodes representing the target protein it binds to, the disease it is currently used to treat, and any related side effects. This allows researchers to easily explore the connections between different entities and identify potential new therapeutic uses for the drug. Graph databases can also be used to store and analyze large sets of data from high-throughput experiments, such as genomics and proteomics data. This can help researchers understand the underlying biology of a disease and identify potential new therapeutic targets for a drug. Additionally, graph databases can be used to integrate data from various sources such as scientific literature, patent information, and external databases. This can help researchers stay up to date with the latest developments in their field and identify potential new therapeutic uses for drugs. The use of knowledge graphs in drug repositioning can help researchers more effectively analyze and understand complex data sets, identify potential new therapeutic uses for existing drugs, and accelerate the drug development process.
Clinical Trail Management
Clinical trials are studies aiming at determining the safety and efficacy of interventions, treatments, or investigational drugs on human subjects. Effective and successful clinical trials are essential in developing new drugs and advancing new treatments. The average cost of a single phase in clinical trials ranges from 1.4 million up to 52.9 million US dollars. In addition, the success rate of clinical trials is considerably low. As reported for certain therapeutic groups like Oncology, the overall success rate of clinical trials could be as low as 3.4%. The high cost and low success rate of clinical trials motivate deliberate analysis of existing clinical trials, inferring knowledge from them, utilizing existing clinical trials in innovative ways, and accordingly carefully designing future clinical trials has been proven to be an effective representation of knowledge inference purposes. Constructing a KG over clinical trial data is vital for advancing the analysis and research of clinical trials. Any data representing medical entities such as studies, drugs, conditions, drugs used in studies, adverts events, and outcomes. Are fused with the knowledge to gain rich information using Graph tech enabling more biomedical applications (e.g., adverse drug event prediction, outcome prediction) than the existing knowledge base in clinical trials. This results in demonstrating its potential utilities in various applications such as drug repurposing and similarity search, embedded analysis & other application uses like drug event prediction & outcome prediction much more.
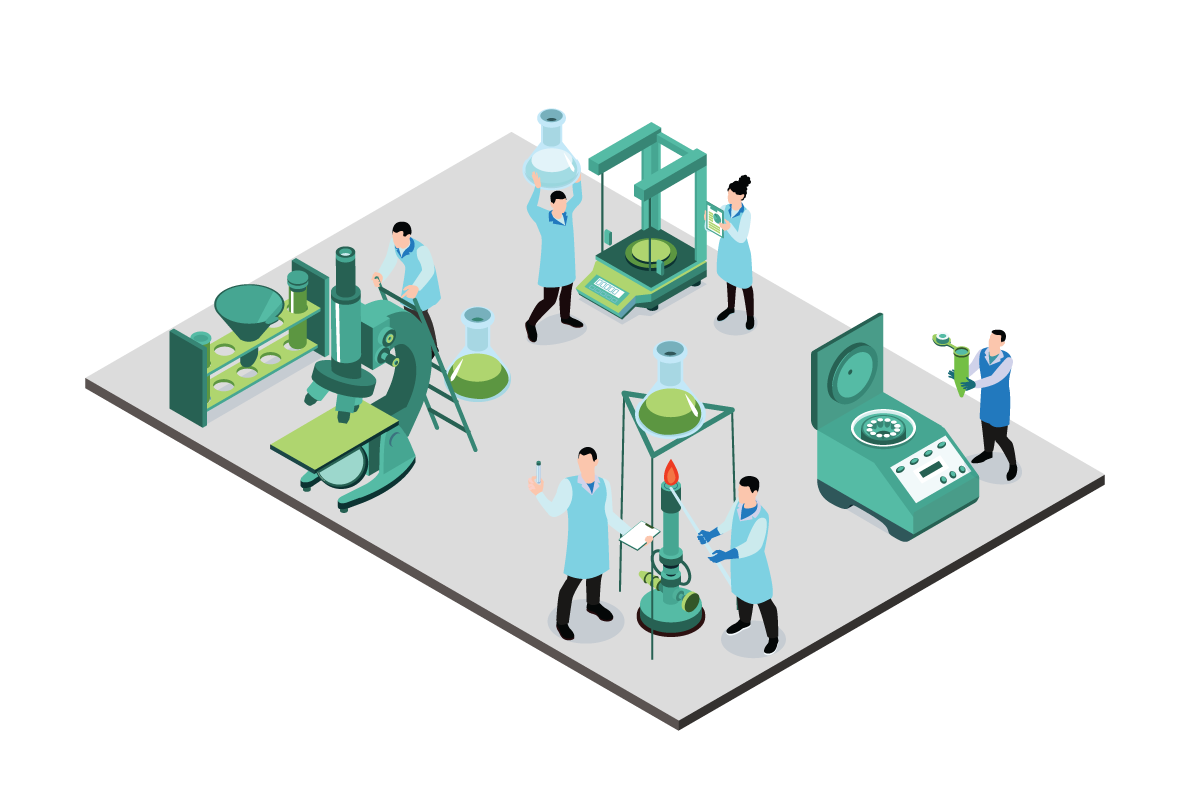
API Manufacturing Process
API (Active Pharmaceutical Ingredient) manufacturing is the process of producing the active ingredient in a pharmaceutical drug. The API is part of the drug that provides the intended therapeutic effect. The manufacturing process for an API can vary depending on the type of drug and its intended use.API manufacturing is a complex and highly regulated process that requires a significant investment in equipment, facilities, and personnel. The quality of the API is crucial for the safety and efficacy of the drug, leaving less time for in-depth analysis. It includes several steps for API manufacturing like synthesis, purification, characterization, formulation, quality control, and packaging. Here, the use of knowledge graphs in API manufacturing can help pharmaceutical companies improve the efficiency and effectiveness of their manufacturing processes, ensure regulatory compliance, improve supply chain management, and support knowledge management.
Supply Chain visibility & improve efficiency
Supply chain visibility refers to the ability to track the movement of goods and materials through the supply chain, from the manufacturer to the end consumer. Knowledge graphs can be used to support this process by storing and analyzing large sets of data on the movement of goods, suppliers, and the relationships between them. In supply chain visibility, knowledge graphs can be used to represent the complex relationships between products, suppliers, transportation, and other related entities. Graph databases can also be used to store and analyze large sets of data from the supply chain, such as inventory levels, shipping information, and production data. This can help companies understand the flow of goods through the supply chain, identify bottlenecks, and make decisions about where to invest in improvements. Graph databases can be used to integrate data from various sources such as sensor data, electronic records, and external databases. Knowledge graphs can be used to support the implementation of SCOR by storing huge multi-dimensional data. Using knowledge graphs in SCOR can help companies more effectively analyze and understand complex datasets, identify potential issues in the supply chain, and make more informed decisions about supply chain operations. This can help to improve supply chain efficiency and support compliance with regulatory requirements
Adverse event reporting/Advanced Drug discovery safety analysis
Adverse event reporting in the pharmaceutical industry refers to the process of collecting and reporting information about any negative or unintended effects of drugs on patients. In adverse event reporting, knowledge graphs can be used to represent the complex relationships between drugs, patients, and any adverse events that occur. Graph databases are used to store and analyze large sets of data on adverse event reporting, such as patient demographics, treatment details, and outcome data. This can help companies identify potential safety risks associated with drugs and make decisions about how to address them. Graph databases can also be used to perform advanced analytics such as network analysis, which can help in identifying key influencers or important nodes in the graph, like specific drugs or patient subgroups that are more susceptible to certain adverse events. Using graph database technology for advanced drug safety analysis can provide a more powerful and effective way to analyze complex data sets, Whereas decision enablement systems or platforms like RDF help every type of user in an organization to look at probability in each case as RDF are the only solutions for Reasoning across industries and the good part is RDF never save data, a platform as ECCENCA works on “in cache system” instead of in-memory Giving more power on performance & other parameters In the other hand, RDF can be used as a single unified platform to represent the complex relationships between drugs, patients, and adverse events, by connecting the drug resource to the resources representing the patients who have taken it and the adverse events that have been reported. RDF are easy to integrate data from various sources, such as electronic medical records, clinical trials data, and external databases. This can help in gaining a more complete understanding of the safety profile of drugs and identifying potential issues RDF can also be used to perform advanced analytics such as querying and reasoning, which can help in identifying key influencers or important nodes in the graph, like specific drugs or patient subgroups that are more susceptible to certain adverse events.
Benefits
Competitive Advantage: By using knowledge graphs, pharmaceutical companies can gain a competitive advantage by identifying new opportunities for drug development, improving the speed and efficiency of their operations, and enhancing their ability to deliver personalized treatments to patients. This can help them stay ahead of the curve and outperform their competitors. | |
Better Patient Outcomes: Knowledge graphs can be used to create personalized treatment plans for patients by analyzing their medical history, genetic data, and other relevant information. By leveraging this data, pharmaceutical companies can develop targeted therapies that are more effective and have fewer side effects. | |
Improving decision-making: Knowledge graphs can help pharma companies make better-informed decisions by providing a comprehensive and interconnected view of all relevant information, such as drug interactions, adverse events, and regulatory requirements. | |
Improved decision-making: Knowledge graphs can provide manufacturers with a comprehensive and interconnected view of their production processes, enabling them to make better decisions. By analyzing data from multiple sources, manufacturers can gain insights that were previously hidden in data silos, allowing them to make data-driven decisions that lead to better outcomes. | |
Streamlining operations: Knowledge graphs can help pharma companies automate and optimize various processes, such as drug development, clinical trial design, and regulatory compliance, by providing a unified and standardized view of the relevant data. | |
Enhanced research and development: Knowledge graphs can assist in the discovery of new drug targets by uncovering relationships between genes, proteins, and diseases. |


